Quick answer: To prove event ROI to a client, agree on the event’s objectives and a short list of KPIs before you sign, record a baseline, and settle who owns the data and when you will get it. Track those KPIs during the event, then report results against each objective. Where the client can put a dollar value on the results, calculate ROI as net benefits divided by fully loaded event costs, times 100. Where they can’t, report return on objectives (ROO) and say so.
Most of the work of proving ROI happens before the event. If you and the client never agreed on what the event should change, how it will be measured, and who holds the numbers, no report written afterward can prove much. Once those three things are settled, the post-event report becomes a comparison of what was agreed against what happened, and it is the document you take into the conversation about next year’s contract.
Many planners are being asked for that proof. Global DMC Partners surveyed 162 meeting and event professionals, 71% of them US-based, for its latest Meetings & Events Industry Pulse Survey. In its May 5, 2026 release of the results, 68% of planners reported stakeholder pressure to prove the business impact of their meetings and incentive programs, and 44% had no ROI tracking in place at all.
This guide is for professional planners, agencies, and DMC teams in the US who plan meetings and events for corporate, association, and nonprofit clients. It covers how to set objectives and KPIs with the client, what to track on site, how to calculate ROI and ROO, and how to write a post-event report that shows value and supports a rebooking. It includes a KPI table by event type, the ROI formula with a fictional worked example, and a report template you can copy. It assumes you already run client events and doesn’t cover how to start a planning business.
In this guide:
- Event ROI vs. ROO
- Set objectives and KPIs with the client before the event
- Event KPIs by event type and objective
- Track data during the event
- How to calculate event ROI
- The cost side: venue, F&B, and room blocks
- Post-event ROI report template
- Presenting the report and winning the rebook
- Common mistakes
Event ROI vs. ROO: which one your client needs
Return on investment (ROI) compares the monetary benefit of an event with what it cost. The ROI Institute, whose ROI Methodology the Event ROI Institute describes as an industry standard for meetings and events, defines it as net program benefits divided by program costs, times 100. A result of 0% means the event paid back its costs and no more.
Return on objectives (ROO) measures how far the event met specific, measurable objectives that were agreed in advance, such as a target number of qualified meetings, a member renewal rate, or a share of attendees who say they will use a new process. It doesn’t require converting results into dollars, which makes it the practical choice when the client’s goals are about learning, engagement, or relationships.
Most client events need both. An association’s annual meeting may have hard numbers on registration and sponsorship revenue and softer goals around member engagement. Agree with the client which objectives will be reported as ROI and which as ROO, and write that into the plan. In the ROI Institute’s framework, not every program is evaluated all the way to ROI. It reserves full ROI studies for programs that are expensive, run for a long time, or reach a lot of people.
You may also hear ROE. Meetings Today’s October 2026 feature on event measurement uses it for return on engagement, and the 2020 white paper the article points to, by Fruition Co. with PCMA, CEMA, Marriott International, and Visit Long Beach, uses it for return on events. Report engagement and sentiment results as part of ROO unless the client asks for ROE by name.
Set objectives and KPIs with the client before the event
Measurement starts in the discovery meeting, before the proposal is signed. The ROI Institute’s model builds the event plan from the top down: start with the business result the client wants, decide what attendees need to do afterward to produce it, then decide what they need to learn or experience at the event. You measure in the opposite order, from attendee reaction up to business impact.
Questions to ask in the discovery meeting
- What business result is this event meant to move: revenue, pipeline, renewals, retention, donations, or something else?
- What should attendees do after the event that they aren’t doing now?
- Which numbers does leadership already watch? Melissa Moten of BCD Meetings & Events told Meetings Today that if you can get time with senior leadership to understand their KPIs, “then you can tailor your event-measurement metrics to those.”
- What is the baseline? Last year’s attendance, renewal rate, or pipeline from the same accounts gives you something to compare against.
- Who owns each data source, and when will you get access? Sales, CRM, membership, and fundraising data usually sit with the client.
- How long after the event should results be measured? Behavior and sales results often take months to appear.
If the client is a corporate team with its own internal process, our guide on how to plan a corporate event shows how they typically set the business objective and sign off on it, which helps you match your plan to theirs.
Write the KPIs into the proposal
Put the agreed objectives, KPIs, baselines, data owners, and reporting dates into your proposal or statement of work. That turns measurement into a deliverable the client has approved, which makes data requests easier later. It also protects you. In the Incentive Research Foundation’s 2026 study on measuring incentive travel, third-party partners named clients’ restrictions on sharing data and a lack of agreed KPIs as major barriers to measuring results. Agreeing on both at the start removes most of that friction.
Measurement takes staff time, survey tools, and analysis, so decide whether it is included in your scope or quoted separately. Our guide on pricing event planning services covers how to scope and price extra deliverables like this.
What a measurable objective looks like
A measurable objective names the result, the number, the group, and the deadline. Three examples:
- “Book at least 40 qualified sales meetings with target accounts during the conference.”
- “Reach 85% renewal among members who attend the annual meeting, measured at the next renewal cycle.”
- “At least 70% of attending managers report using the new review process within 90 days.”
These are illustrations of the format, not benchmarks. The right numbers come from the client’s baseline and goals.
Event KPIs by event type and objective
The table pairs common client events with typical objectives, KPIs worth agreeing on, and where the data usually comes from. Use it as a starting list in the discovery meeting and cut it down to the few KPIs the client actually cares about.
| Event type | Typical client objective | KPIs to agree on | Where the data comes from |
|---|---|---|---|
| Customer or user conference | Pipeline and revenue from target accounts | Target-account attendance, meetings booked, opportunities opened, pipeline and closed revenue from attendees within an agreed window | Registration list, meeting scheduler, client CRM |
| Sales kickoff or internal meeting | Sales readiness and alignment | Attendance rate, session ratings, post-event knowledge check, planned actions, follow-up survey on what was applied | Registration, event app or survey, client HR or sales operations |
| Association annual meeting or conference | Member value, retention, and non-dues revenue | Paid registrations versus goal, first-time attendees, renewal rate of attendees versus non-attendees, sponsor and exhibitor revenue, session evaluations | Association management system, registration, sponsor contracts |
| Nonprofit fundraising gala | Net funds raised and donor relationships | Gross revenue, total event cost, net funds raised, cost per dollar raised, new and returning donors, sponsor renewals | Client fundraising database, ticketing, auction records |
| Incentive trip | Performance against the program goal and retention | Qualifiers versus target, sales lift against baseline, earner retention versus non-qualifiers, participant feedback | Client sales and HR data, post-trip survey |
| Client hospitality or VIP event | Relationship strength with priority accounts | Target-guest acceptance and attendance rate, follow-up meetings held, account renewal or expansion | Guest list, client CRM, account team notes |
| Product launch or press event | Awareness and early demand | Attendance of target media and buyers, coverage, demo requests, early orders | Guest list, media tracking, client sales data |
| Training or certification program | Skills and on-the-job application | Completion rate, assessment scores, manager-confirmed application, performance change | Learning platform, assessments, manager survey |
For incentive programs in particular, our guide to incentive travel for corporate groups covers how to set baselines and compare earners with non-qualifiers.
Meetings Today’s October 2026 feature cited a 2026 survey of “several hundred planners” by the events consultancy Boldpush. According to the article, 69.2% of respondents use registration numbers as an ROI measure, 53.8% use attendee satisfaction or NPS scores, 46.5% use lead generation or sales pipeline influence, and 13.6% said they don’t formally measure event ROI. Registration and satisfaction are easy to collect. Pipeline and retention are what usually tie an event to the client’s budget, so include at least one of them when the objective allows it.
Track data during the event
Build data collection into the run of show so nobody has to rebuild it from memory afterward. Assign an owner to each item before the event opens.
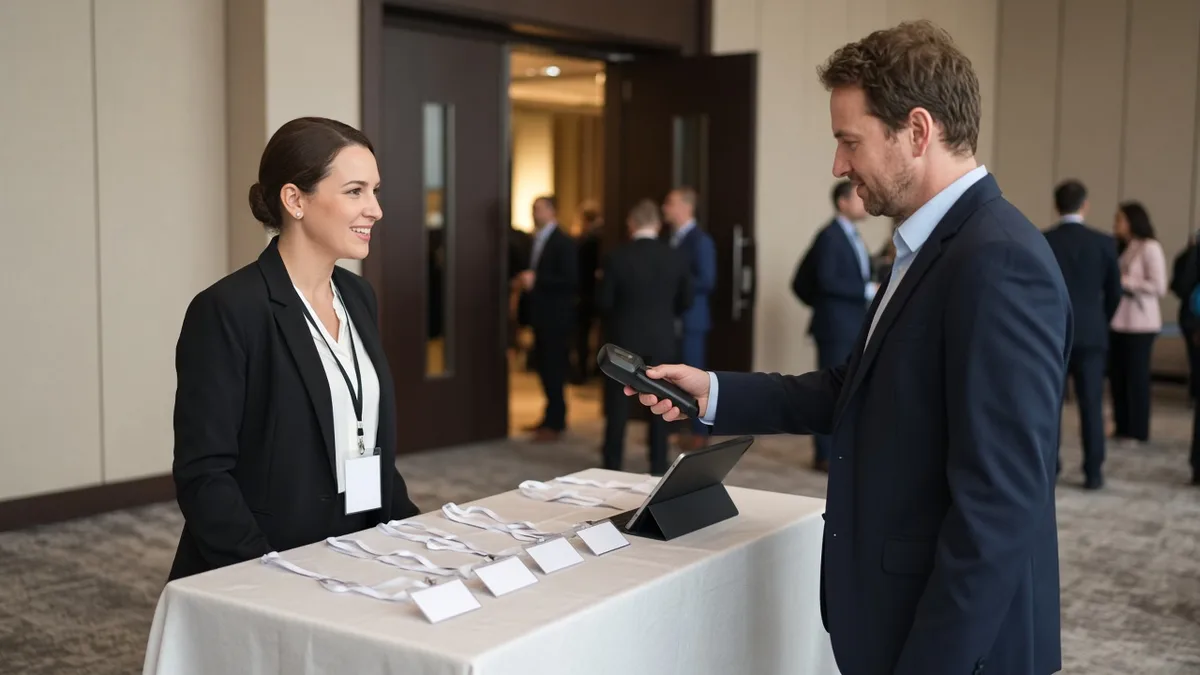
- Attendance. Registrations, check-ins, and no-shows by attendee type, plus session attendance from badge scans or room counts.
- Target guests. For sales and hospitality events, which target accounts and VIPs actually attended, and who met with whom.
- Engagement. Event app activity, poll and Q&A participation, and appointments booked.
- Reaction and planned action. A short survey at the end of the event that asks what attendees plan to do as a result. Moten also suggests asking: “Would you come back to this event, and what are your reasons why or why not?”
- Operations. Daily counts against the guarantees on each banquet event order, the hotel’s room block pickup reports, on-site changes and their cost, and an incident log.
- Vendor delivery. Whether each vendor delivered what was contracted, on time, with notes for the report.
Our event logistics checklist covers the on-site setup, from registration to BEO checks, that these numbers come from.
After the event, plan a second round of data collection. The Event ROI Institute recommends waiting two to four months to measure behavior change, then checking whether attendees carried out the actions they planned. Sales and renewal results may need a longer window, so use the one you agreed with the client.
How to calculate event ROI
The ROI Institute’s methodology uses five levels of evaluation and six steps to get from impact data to an ROI figure.
- Level 1, reaction and planned action: satisfaction, relevance, and what attendees intend to do.
- Level 2, learning: knowledge, skills, contacts made, and attitude toward the client’s brand.
- Level 3, application and implementation: what attendees actually did afterward.
- Level 4, business impact: results such as sales, retention, or cost savings.
- Level 5, ROI: the monetary benefits compared with fully loaded costs.
To get from Level 4 to Level 5, the ROI Institute lists six steps:
- Identify the improvements. Collect the business impact data you agreed on.
- Isolate the event’s effect. Separate what the event caused from what other activity caused. The ROI Institute’s options include a control group, trend line analysis, forecasting, and estimates from participants or managers. The Event ROI Institute calls a comparison with a group that didn’t attend the best method.
- Convert to money. Put a dollar value on each improvement, such as profit on added sales or the cost of a member who doesn’t renew.
- Tabulate fully loaded costs. Include every cost of the event, from planning and delivery to evaluation.
- Identify intangibles. List results you won’t convert to money and report them alongside the figure.
- Compare. Calculate the benefit-cost ratio and ROI.
The event ROI formula
Benefit-cost ratio (BCR) = Event benefits ÷ Event costs
ROI (%) = (Event benefits − Event costs) ÷ Event costs × 100
Use the monetary value of the benefit, usually profit or savings, as the benefit figure. Revenue alone overstates the return, because the client also pays to deliver what it sold. Ask the client’s finance team which margin or value figure to use and note it in the report.
Worked example (fictional numbers)
This example is fictional. The client, the costs, and the results are invented to show the arithmetic. They are not typical or average US prices.
A software company hires your agency to run a two-day customer conference. The agreed objective is closed revenue from attending accounts within six months. The fully loaded costs are:
| Cost line (fictional) | Amount |
|---|---|
| Venue rental and meeting space | $18,000 |
| Food and beverage | $27,000 |
| AV and production | $15,000 |
| Agency planning services | $12,000 |
| Speakers, materials, and marketing | $8,000 |
| Client staff time and travel | $10,000 |
| Total fully loaded costs | $90,000 |
Six months later, the client’s CRM shows $600,000 in deals closed with attending accounts. The client’s sales leaders estimate that 50% of that revenue came from the event, so the attributed revenue is $300,000. At the client’s 40% gross margin, the monetary benefit is $120,000.
- BCR = $120,000 ÷ $90,000 = 1.33:1
- Net benefits = $120,000 − $90,000 = $30,000
- ROI = $30,000 ÷ $90,000 × 100 = 33.3%
The client got $1.33 back for every $1 spent. If you had used the $300,000 in attributed revenue as the benefit, ROI would come out at 233%, a figure the client’s finance team is likely to question. Report the estimate used for isolation, who made it, and the margin source, so the figure can be checked.
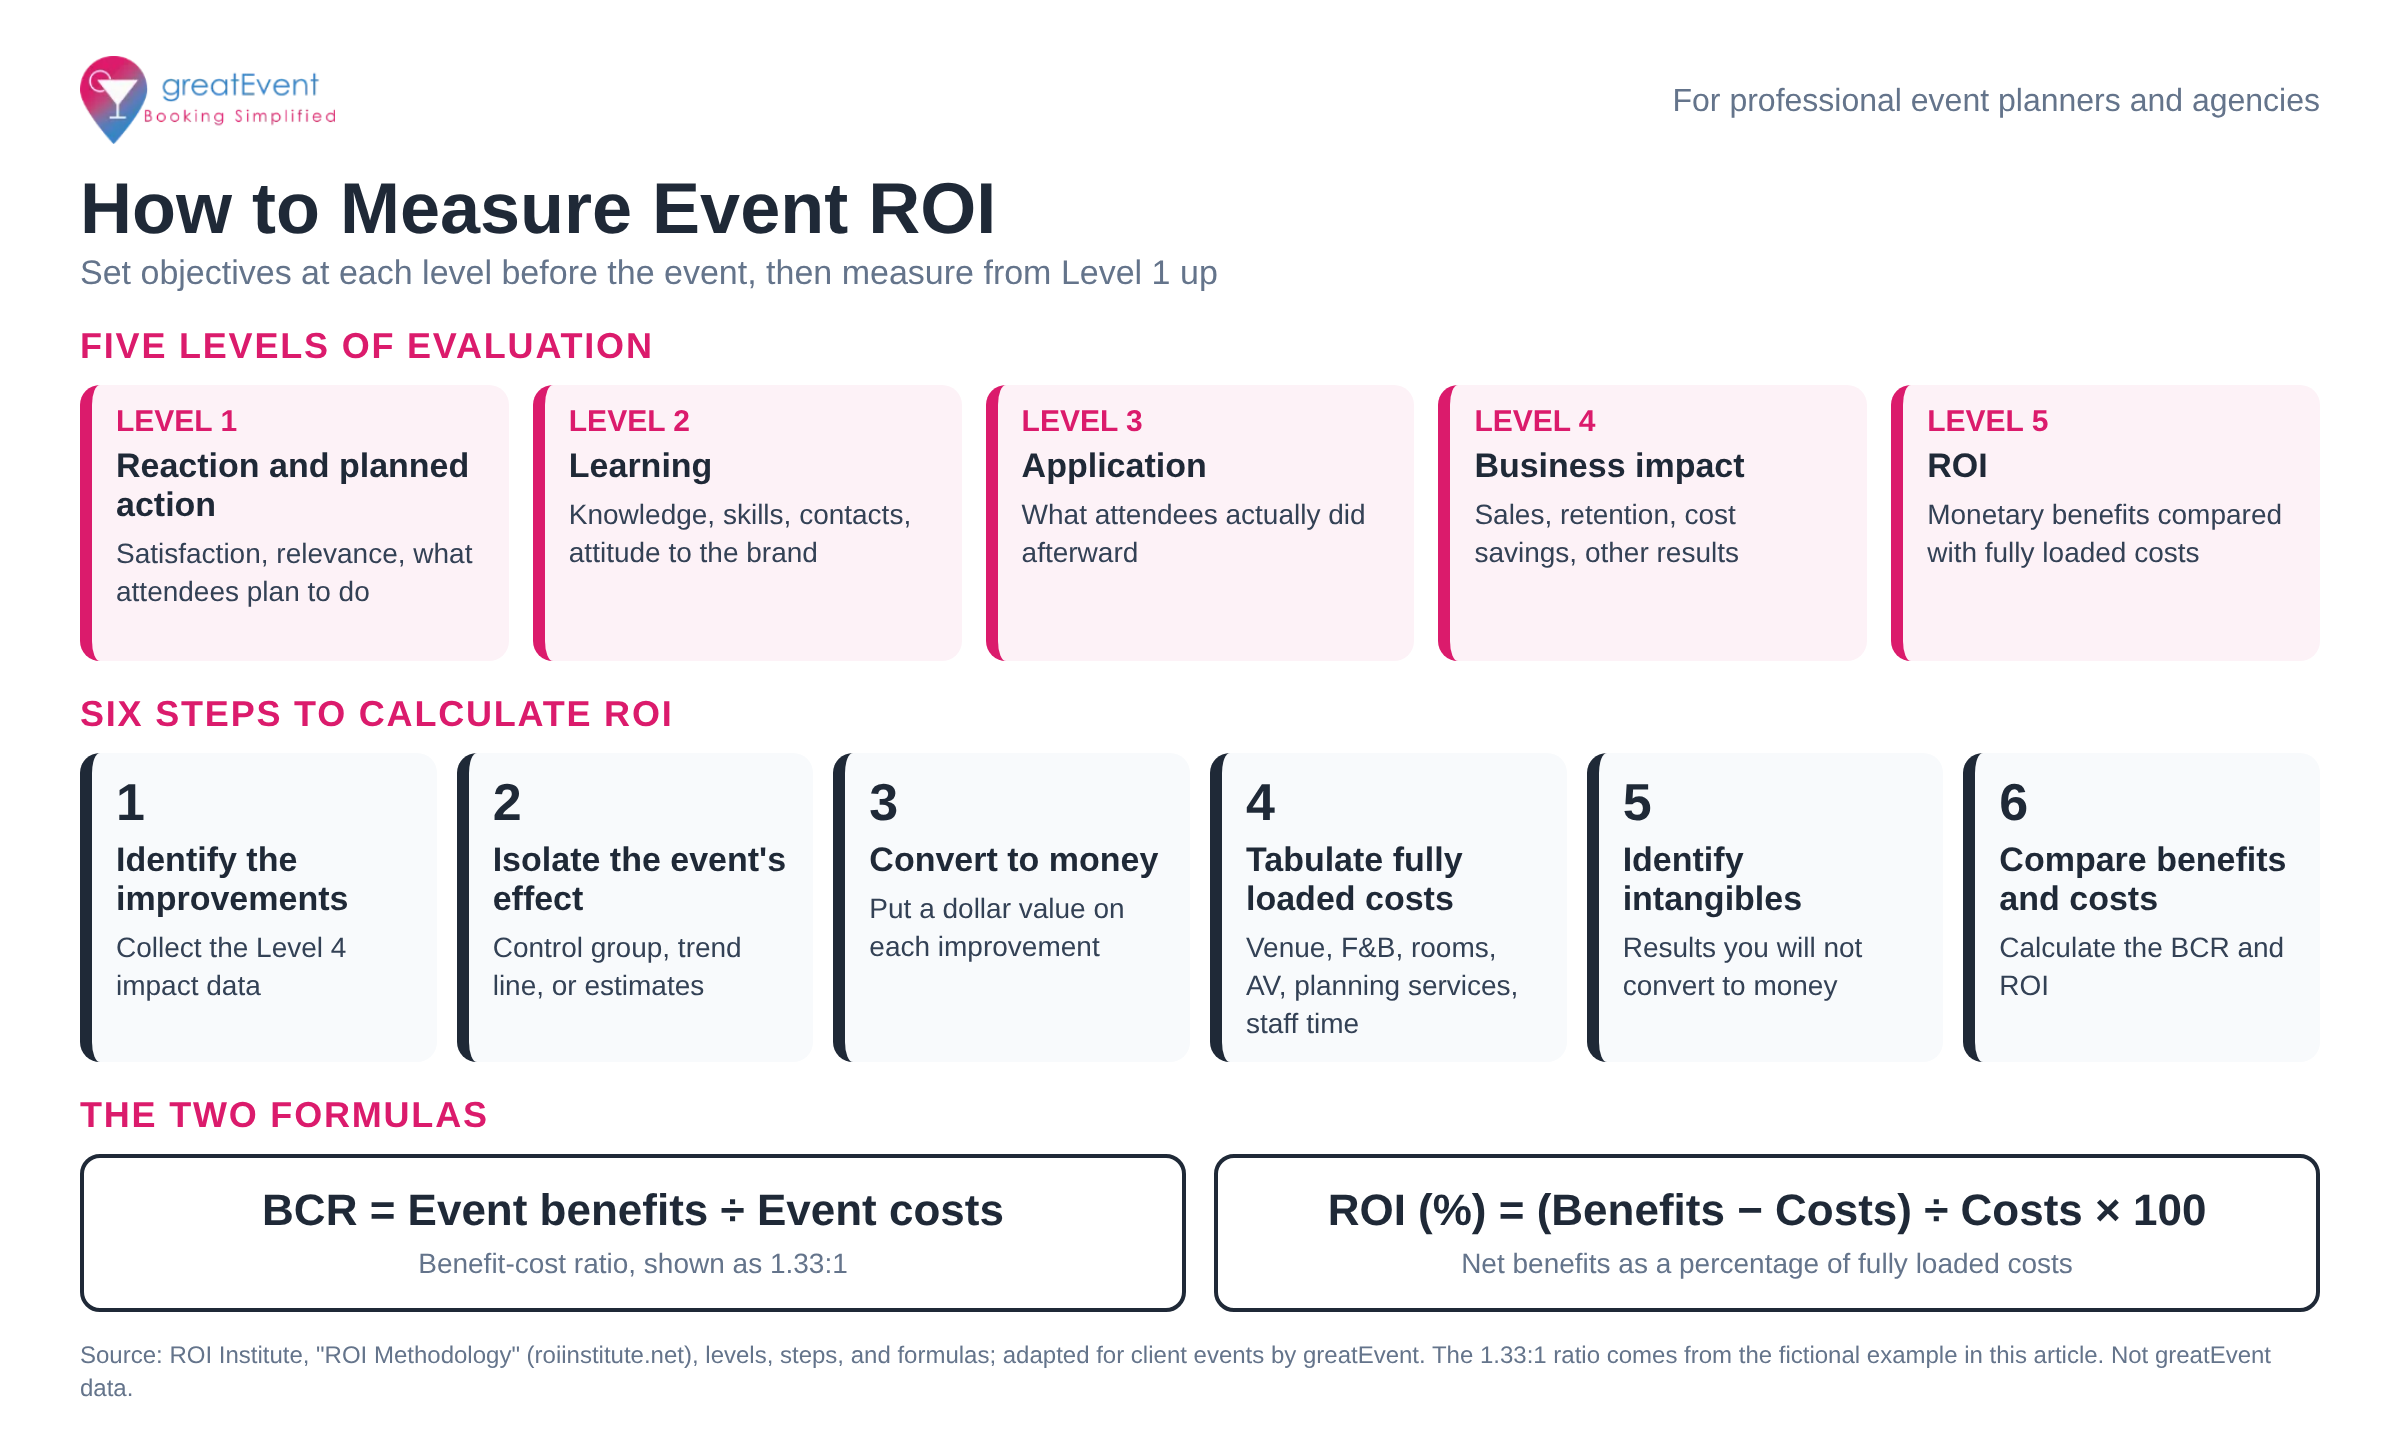
Text version of the infographic. Five levels of evaluation: Level 1, reaction and planned action (satisfaction, relevance, what attendees plan to do); Level 2, learning (knowledge, skills, contacts, attitude to the brand); Level 3, application (what attendees actually did afterward); Level 4, business impact (sales, retention, cost savings, other results); Level 5, ROI (monetary benefits compared with fully loaded costs). Six steps to calculate ROI: identify the improvements, isolate the event’s effect (control group, trend line, or estimates), convert to money, tabulate fully loaded costs (venue, F&B, rooms, AV, planning services, staff time), identify intangibles, and compare benefits and costs. Formulas: BCR equals event benefits divided by event costs; ROI (%) equals benefits minus costs, divided by costs, times 100. Source: ROI Institute, ROI Methodology, adapted for client events. The 1.33:1 ratio comes from the fictional example above.
The cost side: venue, F&B, and room blocks
Clients often focus on the benefit side, but the cost figure is the part you control most directly, and it changes the ROI as much as the results do. In the Global DMC Partners release, venue and hotel rates (68%) and food and beverage (58%) led the cost pressures respondents cited, ahead of general inflation (44%) and airfare (41%).
Report the cost lines a client can act on next time:
- Venue and meeting space. Contracted cost against the original budget, and whether the space fit the attendance you got. Collect proposals on the same terms with a hotel RFP for group bookings and put them side by side in a hotel proposal comparison template, so the comparison is ready when the client asks why you chose a venue.
- Food and beverage. Guaranteed counts against actual attendance and the total against any minimum. Our guide to F&B minimums vs. room rental explains how each pricing model affects the final bill.
- Room block pickup. Rooms picked up against the contracted block and any attrition charge. Our guide to room block attrition and shortfalls covers how those charges are calculated.
- Final bill reconciliation. Check the hotel invoice line by line against each signed banquet event order (BEO) and record any corrections in the report.
- Cost per attendee. Total fully loaded cost divided by attendees who checked in, so the client can compare events of different sizes.
On greatEvent, planners can search and book venues, meeting space, and hotel room blocks and find event vendors in one place. Comparing venue and room block costs at the sourcing stage gives you the numbers you’ll need for the cost side of the report.
Post-event ROI report template
Copy this into a document and fill it in for each event. Send a first version soon after the event with the reaction, attendance, and cost data, then an update once the impact window you agreed on has closed.
POST-EVENT ROI REPORT

EVENT SUMMARY
Client: ______________________
Event name, dates, and location: ______________________
Venue and hotel: ______________________
Report version (initial / impact update) and date: ______________

OBJECTIVES AND RESULTS
Objective 1: ______________________
  KPI: ____________  Baseline: ________  Target: ________  Result: ________
  Met / partly met / not met: ________
Objective 2: ______________________
  KPI: ____________  Baseline: ________  Target: ________  Result: ________
  Met / partly met / not met: ________
Objective 3: ______________________
  KPI: ____________  Baseline: ________  Target: ________  Result: ________
  Met / partly met / not met: ________

ATTENDANCE
Registered: ______  Checked in: ______  No-shows: ______
Target guests or accounts invited / attended: ______ / ______
Best-attended sessions: ______________________

ATTENDEE FEEDBACK (LEVEL 1 AND 2)
Survey response rate: ______
Overall satisfaction or NPS: ______
Would return (yes / no) and top reasons: ______________________
Top planned actions reported: ______________________

APPLICATION AND IMPACT (LEVEL 3 AND 4)
Follow-up survey date and response rate: ______________
Actions attendees carried out: ______________________
Business results in the agreed window: ______________________
Method used to isolate the event's effect: ______________________

COSTS
Venue and meeting space (budget / actual): ________ / ________
Food and beverage (guarantee / actual / minimum): ________ / ________ / ________
Room block (contracted / picked up / attrition charge): ________ / ________ / ________
AV and production: ________
Planning services: ________
Other vendors: ________
Client staff time and travel: ________
Total fully loaded cost: ________   Cost per attendee: ________

ROI
Monetary benefits (and how they were valued): ______________________
BCR (benefits / costs): ________
ROI % ((benefits - costs) / costs x 100): ________
Intangible results not converted to money: ______________________

VENDOR AND VENUE PERFORMANCE
What was delivered as contracted: ______________________
Issues and how they were resolved: ______________________

RECOMMENDATIONS FOR NEXT TIME
What to keep: ______________________
What to change: ______________________
Proposed objectives and KPIs for the next event: ______________________
Suggested dates and venue options: ______________________
If the client’s finance team needs the next event’s budget in a standard format, our corporate meeting budget approval template pairs well with the recommendations section.
Presenting the report and winning the rebook
The report is also what you bring to the conversation about the next event. A few habits make it more useful to the client:
- Lead with the objectives. Put the objectives-and-results table on the first page. Executives want to know whether the event did what it was meant to do before they read about the menu.
- Write for the person who signs the budget. Your contact may love the event, but the report is often forwarded to finance or leadership. Use their KPIs and plain numbers.
- Be honest about misses. If an objective wasn’t met, say so and explain why and what you would change. A report that only shows wins is harder to trust.
- Show your work. State the isolation method, the margin used, and the data sources, so the ROI figure holds up when someone checks it.
- End with next year. Propose the next event’s objectives, KPIs, and measurement plan. Suggest dates and venue options while the results are fresh.
- Review it in person. Walk the client through the report in a meeting instead of only emailing it.
The data also supports your own pricing. When you can show results across several events, it is easier to explain what event planners charge and why measurement is part of the service.
Your clients’ own teams often struggle with this. Vendelux, a company that sells event data and attribution tools, surveyed more than 120 B2B marketing and events leaders for its 2026 B2B Events Report, and 86% said they can’t accurately attribute ROI back to events. If you bring a measurement plan to the first client meeting, you are offering help with a problem many of these teams say they have.
Common mistakes
- Setting KPIs after the event. Without objectives and a baseline agreed in advance, the report can only describe what happened.
- Reporting attendance and satisfaction only. They matter, but they rarely answer the question leadership asks about business impact.
- Using revenue as the benefit. Use profit or another monetary value the client’s finance team accepts.
- Claiming every result for the event. Isolate the event’s effect and state the method.
- Leaving out costs. Client staff time, attrition charges, and on-site changes all belong in fully loaded costs.
- No data access agreement. If the CRM or membership data sits with the client, agree in writing when and how you’ll receive it.
- Waiting too long to report. Send a first report soon after the event, then update it when the impact data comes in.
Plan your next client event on greatEvent
Your ROI report is measured against the budget you set when you source the event. On greatEvent, planners can book venues, meeting space, and hotel room blocks for their clients’ events and find event vendors. Register as a professional planner to compare venue and room block options before you build that budget. Need help finding the right fit? A member of the greatEvent team can help you source venues for your next event.
Register as a professional planner
Frequently Asked Questions
What are the most important KPIs for an event?
▾
The ones tied to the client’s objective. Registration, attendance, and satisfaction are common starting points. Add at least one business KPI, such as pipeline, renewals, net funds raised, or retention, when the objective allows it.
What is the difference between event ROI and ROO?
▾
ROI compares the monetary benefit of an event with its fully loaded cost. ROO measures how far the event met specific objectives agreed in advance, without converting them to dollars. Many client events report both.
How do you calculate event ROI?
▾
Subtract the total event costs from the monetary benefits, divide by the costs, and multiply by 100. For example, $120,000 in benefits against $90,000 in costs gives an ROI of 33.3%.
What should a post-event report include?
▾
Objectives and results against the agreed KPIs, attendance, attendee feedback, business impact, a cost breakdown, the ROI or ROO, vendor performance, and recommendations for the next event.
When should you send a post-event report?
▾
Send a first report soon after the event with attendance, feedback, and cost data. Update it once the agreed impact window closes, since sales and behavior results can take months.
What if the client won’t share sales data?
▾
Agree on data access in the proposal before the event. If the client still can’t share it, report ROO against the objectives you can measure and note which results are missing.
How do you measure ROI for a corporate event?
▾
Agree on the business result with the client, set a baseline, isolate the event’s effect, convert the result to money, and compare it with fully loaded costs.
Research and sources
Sources reviewed October 27, 2026. Survey figures are reported as each organization published them and are not greatEvent data. The worked example and the sample objectives are fictional.
- ROI Institute, “ROI Methodology” (roiinstitute.net). Five levels of evaluation, the steps from impact data to ROI, isolation techniques, fully loaded costs, and the BCR and ROI formulas.
- Event ROI Institute, Dr. Elling Hamso, “Seven Steps to Event ROI” (eventroi.org). Setting objectives from business impact down, measuring from reaction up, the two-to-four-month window for behavior change, and control groups.
- Global DMC Partners, “Global DMC Partners’ Latest MICE Industry Pulse Survey Reveals Growing Confidence in In-Person Events,” May 5, 2026 (globaldmcpartners.com). Results of its latest Meetings & Events Industry Pulse Survey: 162 respondents, 71% US-based; stakeholder pressure, ROI tracking, and cost pressures.
- Rob Carey, “Measures of Success: Determining ROI, ROO, ROE,” Meetings Today, October 5, 2026 (meetingstoday.com). Figures from a 2026 Boldpush planner survey as reported in the article, ROE, and comments from Melissa Moten of BCD Meetings & Events.
- Incentive Research Foundation, “Measuring Incentive Travel Program Effectiveness,” 2026 (theirf.org). Barriers to measurement, including client data access and lack of agreed KPIs.
- Vendelux, “Events Are in the Hot Seat: 2026 B2B Events Report” (vendelux.com, full PDF report). Survey of more than 120 B2B marketing and events leaders on ROI attribution.
Compare vendors for your next event
Search caterers, photographers, florists, planners, and rentals — then send one request to several vendors at once.